Saturday, October 24, 2009

Sediment plates and Long-term data!

by CJ Carroll

This blog summarizes the past two activities completed by the Research Methods in Marine Ecology class.


On October 6, 2009, we collected and analyzed sediment plates that were submerged in the creek behind SSU for about 6 weeks. This was completed to determine what organisms would settle and grow on the plates. Also, pairs of plates were set at different levels in the water column to determine if different things settle in different areas. The three areas in the water column were the surface, the middle of the water column, and the lower intertidal area. After six-weeks on being in the water the sediment plates were pulled up with the aid of a net to capture any vagile organisms (opposite of seesile organisms) that are hanging on to the plates. If organisms were large enough to distinguish individuals or individual colonies with the naked eye, then the individuals and colonies were counted. For organisms that were not large enough to see with the naked eye the percent of composition on the plate was determined. All six plates were analyzed at the dock, photos taken and then plates clean.
The surface sediment plates were dominated by sea squirts, different types of algae, and mobile invertebrates (e.g. crabs and shrimp). The middle of the water column plates contained different types of algae, shrimp, and crabs, but not in the levels seen at the surface. Also, bryozoan colonies and titan acorn barnacles were found in the middle of the water column. The lower intertidal plates were either a muddy slime or mostly empty. A little bit of green filamentous algae, titan acorn barnacles, and bivalves were also found. Diversity was calculated for each area using the Shannon-Wiener Biological Diversity Index, which measures on a 5 point scale with 5 being diverse and 1 not diverse. The lower intertidal area was the least diverse with an index of 0.91 and the middle of the water column was the most diverse with an index of 1.53.


This is a photo of one of the surface plates covered in green filamentous algae, sea squirts, and brown-green algae.


This is a photo of one of the plates that was lowered into the middle of the water column. It is covered in brown algae, brown filamentous algae and bryozoan colonies.


On October 13, 2009, we downloaded long term data from the National Data Buoy Center’s website. The data was downloaded from the 2008 Standard Meteorological Data and provides information about offshore conditions. The erroneous data was deleted and the wind speed and wave height separated. Averages and standard deviations of both categorized and graphed. When comparing the two graphs over one another, a clear trend presents itself. As the wind speed decreases, the wave height decreases. As the wind speed increases, the wave height increases. This correlation leads to the hypothesis that the wind speed has an effect on the wave height.

Monday, October 5, 2009

Sediment sampling


Written by Dana Davis


On September 29, 2009, our class went into the marsh at low tide behind Savannah State University's marine science building and collected sediment samples. Push corers were used to collect sediment from 5 different sites. The push corers used were clear, hard plastic tubes that opened on each end, similar to a paper towel roll. By pressing the push corer straight into the ground until sediments reached a marked line of 10 cm, the sediments were collected with little disturbance of the environment. The sample sites began at the outer edge of the marsh and continued towards the creek at intervals of about 3-5 m apart. Next, the sediment samples were taken back to the lab to be sieved and weighed. A sieve consists of several plates with different sizes of mesh in between in order to separate the different sized sediment particles. For each sample, the sediment was placed on the top of a sieve beginning with 500 micrometers, then 250, 125, and ending with 63 micrometers. Tap water was used to help transfer the sediment through to each plate. This was a time-consuming task, and 4 of the 5 samples were separated out. Next, the sediments were placed into the dryer on pre-measured tins for 24-48 hrs. The sediments were then re-measured when completely dry.

The 500 micrometer sieve was not included in further calculations due to the large amounts of plant matter, debris, and rocks in all samples. The largest percent of sediment for all 4 samples was deposited in the 125 micrometer sieve consisting of fine sand. For sites 1 and 3, the samples collected farthest from the creek, the majority of sediment was composed of fine sand particles followed by medium sand particles. Sites 4 and 5 were collected closer to the creek and were comprised of mostly fine sand particles with very fine sand being the next abundant sediment.

The picture above shows a sediment sample after sieving and drying. The top left is the 500 micrometer collection then going clockwise to the 250, 125, and 63 micrometer samples.
The figure above shows the percentage of different sized sediments (250, 125, and 63 micrometers) for each site.


Sunday, September 20, 2009

Periwinkle snail: effects on plant biomass

Written by Donna McDowell


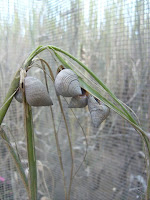
On the 22nd of September, it had been two weeks since the cageing experiment of periwinkle snail Littoraria irrorata on saltmarsh cordgrass Spartina alterniflora was initiated. Today was the day for the class to go outside and record the findings of the experiment. The weather was great and all were happy to be in the field. Students went out to untie the tops of the cages and unveil the findings.

Once cages were opened the teams then had to count the number of snails, measure height (mm) of 5 plants within each experiment, count radulations per plant, and assess % damage. The three densities of snails in the experiments were: 13, 600, and 1200. Sometimes within the experiments there were unfortunate victims. We found dead shrimp, fiddler crabs, and a mummichog. After all the data was collected the snails were returned to the marsh to live their happy fungi-eating lives.


The mean plant height was highest for the medium treatment, second for high, and third for lowest. Also, the mean number of radulations was greater for the medium treatment, 19.2, than the high treatment, 8.8, probably due to more marshgrass being alive to count the radulations. The percentage damage, of course, was greatest for the high treatment, 82%, and lowest for the low treatment, 2%.

Click on figures to view large version


Tuesday, September 15, 2009

The waters are teeming with plankton!

Written by Amber Wilkinson

This week, September 8, we looked at plankton in the water column 0.5 um and larger. Before conducting two plankton tows we discussed diel vertical migration and larval transport. Diel vertical migration is a behavioral pattern in which organisms come up to the surface at night and down during the day.

The collection method was new to me. Plankton tows I have done in the past were off the side of docks and boats that are in neutral. This method used a bongo net which consisted of two plankton nets side by side resembling bongo drums. The bongo layout allows for replicate samples for each tow. Tows were conducted for 5 minutes. Tow 1 sampled the top meter of the water, and tow 2 sampled the entire water column (an oblique tow). The boat speed for our plankton tow was 2 knots. We sampled against the current and in the wake of the boat. If you want to measure the volume of water sampled, it is not recommended to sample in the wake of the boat because the prop creates turbulence, disrupting the sample area.

After a 5 minute tow, the net was rinsed in the water by holding the net’s ring and dipping the net in the water vertically 2-3 times to get most of the sample down in the cod end. The cod end is the end of the net where the sample collects. Our nets have mesh openings in the cod end to allow for more water flow. Before conducting another tow, the net was rinsed for 30 seconds in the water without the cod end to minimize contamination between samples.

To keep a lot of water out of our sample jars (more condensed samples) the contents from the cod end can be rinsed into a sieve than from there into the sample jars. For the purpose of our class, we looked at our samples in Pyrex dishes (9x13in).

Back in the lab, we observed the samples under dissecting microscopes. The diversity amazed us, there were fewer species near the top. The surface tow contained crab larvae and a skeleton shrimp. An interesting observation was that the crab larvae followed the light from the microscope when we were looking at the different species in the petri dishes. This may suggest why we found so many crab larvae near the surface. Also, there was greater diversity throughout the water column. Juvenile shrimp, mature smaller shrimp, larval fishes, parasitic isopods, crab larvae, and a lot of plant matter were in the oblique tow.

Tuesday, September 8, 2009

Community Dynamics and Settlement

Top-down regulation of Spartina alterniflora (saltmarsh cordgrass) by the periwinkle snail
September 1, 2009
Written by Kelli L. Edwards
The salt marsh community is regulated by a trophic cascade. Although some communities are typically structured in a pyramid, some consist of an inverted pyramid. These inverted pyramids are most likely to be associated with pristine aquatic communities, where there are much larger animals and fewer trophic levels. Despite the differences, each trophic cascade consists of the primary producers, primary consumers, secondary consumers, and so on.

Each one of these trophic cascades is regulated by either top-down regulation or bottom-up regulation or both. Top-down control is determined by how many predators or consumers are present, while bottom-up control is determined by how many resources are present (Silliman and Bertness, 2002). Plant biomass is greatly controlled by predators and their feeding ativities. Beyond other environmental factors such as nutrient availitiblity and salinity, top-down control may be a key determinant of marsh grass growth.

In a 2002 paper, Silliman and Bertness investigated the effect of top-down regulation with the periwinkle snail Littoraria irrorata.

This snail feeds on a fungus which grows on the Spartina grass. With enough snails, they can devour a Spartina population. The periwinkle snail does have natural predators which help to indirectly regulate the consumption of Spartina.
For our class activity we investigated the principle of top-down regulation. We are to assess the effects of density-dependent snail grazing on Spartina grass growth by maintaining constant snail densities in isolated cages. Snails were put into cages at low (13 per meter square), medium (600 per meter square) and high (1200 per meter square) densities. Over the course of the next 2 weeks, we will monitor the growth and consumption of Spartina alterniflora.

Low density:

Medium density:

High density:

Sunday, August 30, 2009

Estuarine Transect


August 8, 2009
Written by Kelli L. Edwards

We began our afternoon setting sail from the Savannah State University dock, located at Country Club creek with the bright hopes and aspirations of completing one successful estuarine transect. After much confusion with boating troubles, we launched out into the water on the Pontoon. Although much older than the Tiger II and the Sea Otter, the Pontoon, playfully re-named the Pelican, the Pontoon made for a rather pleasant ride. The purpose of this sail was to combine the useful knowledge we just obtained about changing salinity with hands-on-experience using the CTD.

This handy gadget is approximately 40lbs according to estimation and is deployed off the deck of any seaworthy vessel. Most CTD's record salinity, water temperature, dissolved oxygen concentration, and depth. Each student was given their own specific detailed activity. CJ recorded location using the GPS and kept track of depth, Amber helped Dr. Ogburn with deployement and retreival, Dana helped with GPS monitoring along with CJ, and Donna was our personal photographer and navigator. With myself, "Captain Kelli" guiding us along the waterway, our class successfully reached 4 stations, with the farthest located in the Wilmington River.

Dr. Ogburn carefully instructed each student on the launching of the CTD. This device must be regarded with much care because of its sensitive nature.


For my portion of our study, I looked at the changees in salinity with depth and location as we moved along our transect.
Salinity ranged from 29.2-31.3. According to the data collected, there is not much change in salinity with respect to depth. For our first location in the Wilmington river, the greatest depth (10.356m) and the lowest depth (0.824) varied little when it came to salinity(31.3 and 31.1 respectively). Salinity typically changes in response to depth when the water column is well stratified. With our waterways being both partially mixed and well mixed because of our tidal system, the water column is pretty universal with respect to salinity. One of the most interesting points of this lesson is that salinity changes dramatically in response to freshwater runoff. According to Blanton et al., there can be rapid changes in salinity in response to freshwater input. Even more fascinating is the effect of climate on salinity. In months of dryer almost drought-like conditions, salinity is much higher than in times of heavy seasonal rains. Over the course of time there have been dramatic changes in salinity of coastal Georgia Waters. Considering our season of tropical storms and high freshwater discharge, one can expect continual lower salinity as compared to those years of drought.
Even vegetation changes in response to environmental fluctuation. In 2004, Higinbotham et al. found that vegetation is characteristically distributed along estuaries in response to the salinity gradient in the Altamaha and Satillia estuaries. Juncus (Juncus roemerianus and Spartina cynosuriodes) was found in salinities ranging from 21-1, brackish marsh vegetation (S. cynosuroides and S. alterniflora) was found in salinities ranging fom 15-1, and vegetation catagorized as freshmarsh was found upstream at salinitieis less than or equal to 1.

Overall, this day was extremely successful in understanding the various changes that waterways undergo in response to environmental fluctuation.

Wednesday, August 19, 2009

9.18.09 - Where are we and what is the water like today?

Written by Dr. Matt Ogburn

Our first day started out the usual way, with introductions and a review of the syllabus. I gave an introductory lecture on the scientific method, Global Positioning Systems (GPS) and water column properties. These properties include things like salinity, temperature, pH, dissolved oxygen, light and others that describe the physical, chemical and biological conditions in the water. After my lecture, which hopefully didn't put too many of the students to sleep, we took a variety of equipment out to the Savannah State dock to measure some of these properties in Country Club Creek.

Place is very important in science, so we attempted to compare the estimates of our location given by three identical (somewhat old) Garmin 12 GPS handheld receivers. Despite the fact that I tested them out before class, two of the three had low batteries and quit on us before getting a reading. After class, I changed the batteries and completed the comparison in the parking lot outside of my lab building. All three gave measurements within about 3 m of each other or within one parking space (see photo below in which each yellow pin indicates the position given by one GPS unit). The image was created using Google Earth.

One thing that is immediately obvious when you visit the Georgia coast is that our water isn't very clear. We used a Secchi disk to measure turbidity (how cloudy the water is due to suspended particles) and were only able to see it to a depth of just over 1 ft. In clear water, a Secchi disk can be seen at depths of over 100 ft! We also measured salinity, temperature, pH and dissolved oxygen using a variety of instruments from simple pH strips and handheld refractometers to the workhorse YSI 85 and somewhat more capable YSI 556. Not all of these instruments agreed on every measurement, highlighting my point during lecture that it is essential to make sure an instrument is properly calibrated before using it to collect data.

Stay tuned for more pictures and future posts from the students...

Welcome

Written by Dr. Matt Ogburn

Thanks for tuning in to the blog for Research Methods in Marine Ecology Fall 2009 at Savannah State University. The class, made up of 5 Marine Science graduate students, will be exploring the waters and marshes around Savannah, GA while learning a variety of techniques marine ecologists use to study our coasts, estuaries and oceans. The students will be writing weekly updates and posting photos of our activities. Find out more about me at my website or check out my blog From the Shore on coastal and ocean science, policy, conservation and education. To learn more about undergraduate or graduate programs in Marine Sciences at Savannah State University check out the program website and NOAA Sponsored Programs at SSU.